How to Enable Debugging on your WordPress Site?
If you are working on managing a WordPress website, you must have the basic knowledge to maintain it. One of the crucial parts of it is to understand debugging and learn how to enable debugging in WordPress. This helps you in identifying and resolving errors that lead to poor site health. Debugging results in smooth interaction with your Website. It is like switching on the light to find where the ghosts are hiding and how to show them away.
And darling, don’t be all confused. You do not need to be all techie to get this done. Just have a heart to understand the basics and this article will guide you through smoothly. This WordPress site debugging step-by-step guide is the only tutorial you need to understand what debugging is, what kind of errors pop up while running a Website, and how to tackle it all.
Let’s get going and start with the super basics.
What is WordPress Debugging and How Can You Enable It?
To put it very simply, debugging is finding the dirty corners of your website and cleaning them well. It helps you to identify and fix issues in a WordPress website or a Plugin. For this, you need to check code, examine error logs, and use debugging tools whenever needed. This helps you in solving broken links, malfunctioning plugins, or themes, PHP errors, and Database connection problems.
This is an important step to keep your site health in check as minor issues can lead to site crashes, security vulnerabilities, and broken links. For every beginner, it is important to know that WordPress provides you with an inbuilt site debugging system. The main tool is known as WP_DEBUG. Now, how does this help? Well, it helps in displaying error messages directly on your site page, thus, it’s easy to pinpoint and work on the error.
Various WordPress Errors affecting Site Health

Well, here’s the list of most common problems that every WordPress user faces some or the other time.
- White Screen of Death: In this error, a blank white screen appears instead of your Website. This can occur because of full memory usage, any plugin or theme, or some syntax errors.
- Internal Server Error: This is also known as 500 error wherein an error on the server side prevents your site from loading. This can happen because of a corrupted .htaccess file, any plugin conflicts, or PHP memory limit issues.
- 404 File Not Found: This is the most common error faced by Website users. This happens when you delete some content or have some error in permalinks settings.
- Connection Timed Out: When a site takes too long to load, it usually results in ‘Connection timed out error.’ This is common when your server is trying to manage more than its capacity or when you are using a shared hosting platform. Check for any Plugin bloat or unoptimized themes. If possible increase the memory limit or just change your hosting platform.
- Database Connection Error: Just as the name suggests, this error occurs when your WordPress site is not able to connect with your database. This can happen because of incorrect login credentials or corruption of the database.
- Syntax Error: This is the user side error because of any incorrect code or syntax. This happens while doing manual changes to the code of themes or plugins. You can simply undo the recent changes or access the file via FTP server.
- Memory Exhausted Error: Just like your mobile devices, your Website has a fixed amount of memory storage, which, if full, results in memory exhausted error. You need to check for any heavy themes, plugins, or increase your memory from your hosting provider.
- Stuck in Maintenance Mode: This usually happens after an update. Here, even after the update is complete, your site remains under maintenance mode. This usually happens due to very large updates or interrupted WordPress updates.
Pro-Tip: Enable Server Side Error Log
Well, if it is getting tricky for you to access PHP error logs, get in touch with your website host. Ask them to provide you with the server side error logs. These would help you catch the exact error and solve it efficiently. It is important to get in touch with your host as not all errors will be added to wp-config.php file because of permission issues.
Checking the WordPress Site Health
Nope, it’s no rocket science to check your WordPress site’s health. WordPress provides all such facilities in-built! A healthy site is crucial for performance and security, both. This helps you sustain your site at optimum costs in the long-run. The most popular CMS WordPress provides features to maintain your site. One of them is Site Health tool.
What is the WordPress Site Health Tool?
It is an in-built feature of WordPress that provides a health check of your website and highlights the issues that must be resolved. This gives you a clear understanding of your site status and helps in troubleshooting errors in WordPress.
This tool helps evaluate some of the major factors that lead to an efficient site operation
- PHP Version: This ensures that a WordPress site is using an up-to-date version of PHP that is essential for performance and security.
- HTTPS Status: Confirms if your site is secured with SSL which is critical for user trust and data protection.
- Plugin and Theme Updates: Alerts users if any Plugins or Themes are outdated and requires updates. This is essential as outdated software can pose security risks.
- Site Performance: This checks the site loading time, responsiveness, and other performance aspects that affect the site.
- Debugging Information: Here, you can check error logs and essential WordPress debugging information.
How to Check your WordPress Site Health (Step-by-Step)
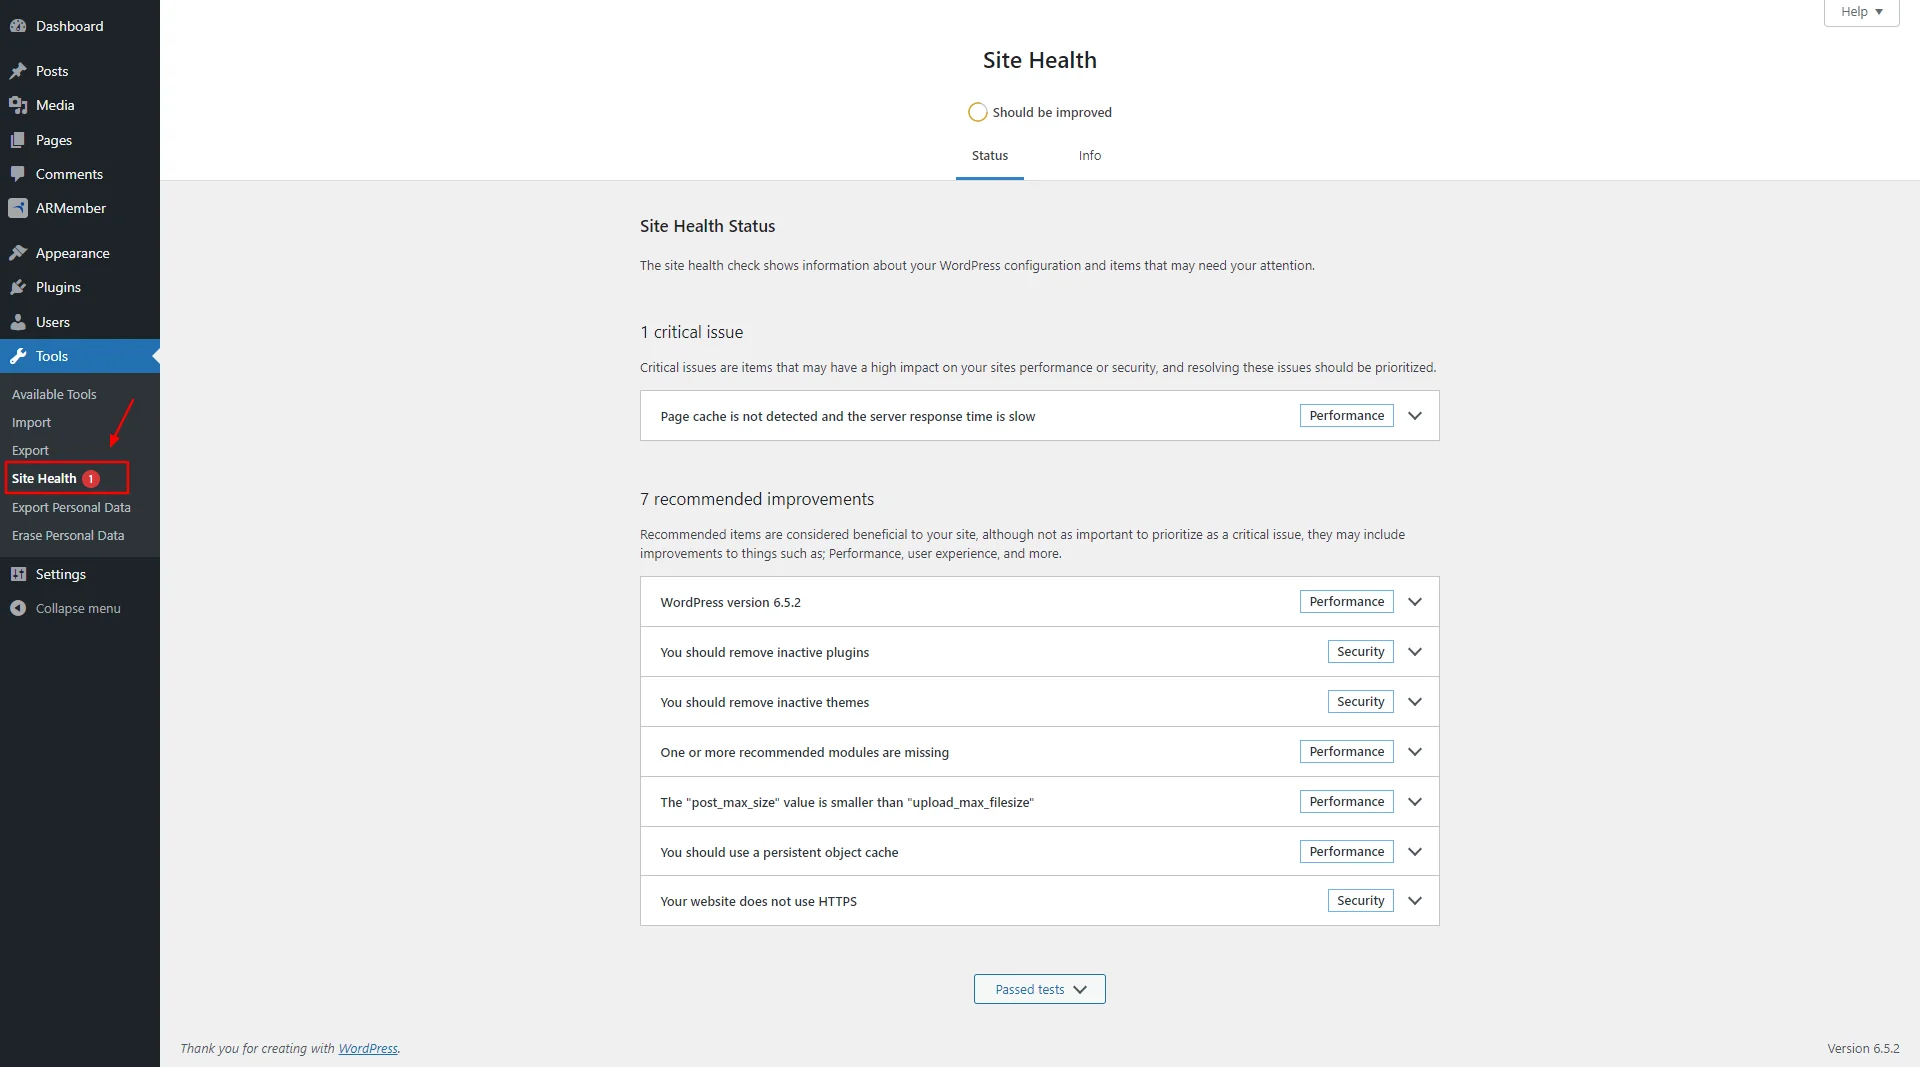
- Step-1: Log in to your WordPress Admin Dashboard using the credentials
- Step-2: On the left-hand panel, go to the Tools Section and Click on the option of Site Health.
- Step-3: You will see the Site Health screen wherein you have two tabs, Status and Info.
- Step-4: The Status Tab displays any critical issues or information related to your site’s health
- Step-5: The Info tab gives you detailed information about your site environment that includes server settings, active themes, and plugins.
- Step-6: Check the recommendations and follow them. This section will suggest to you the improvements you can make.
Wasn’t this pretty easy to understand and grasp? Now, let us move ahead to the next part and check how to easily enable WordPress debug mode.
Here, take a note that debugging should ideally be done on a staging site or a local copy of your Website. If you enable it on the live site, there are chances of error details exposure to the visitors. This is not suggested or even secure.
How to Easily Enable WordPress Debug Mode (Step-by-Step)
Start following through these steps to enable the WP_ DEBUG Mode.
What is WP_DEBUG
This is a constant that can be defined in the wp-config.php file of your WordPress installation. When you enable it, it displays error messages and notices that helps identify the site error and solve it efficiently.
Enabling WP_DEBUG Mode
Step-1 Access your WordPress Site Files
You must access your WordPress installation files to move ahead in the process. You can access it through,
- cPanel File Manager provided by most hosting providers to navigate to WordPress files
- By using an FTP client like FileZilla to connect with your server. Here, you would need your FTP credentials that can be obtained from your hosting provider.
Step-2 Locate the wp-config.php File
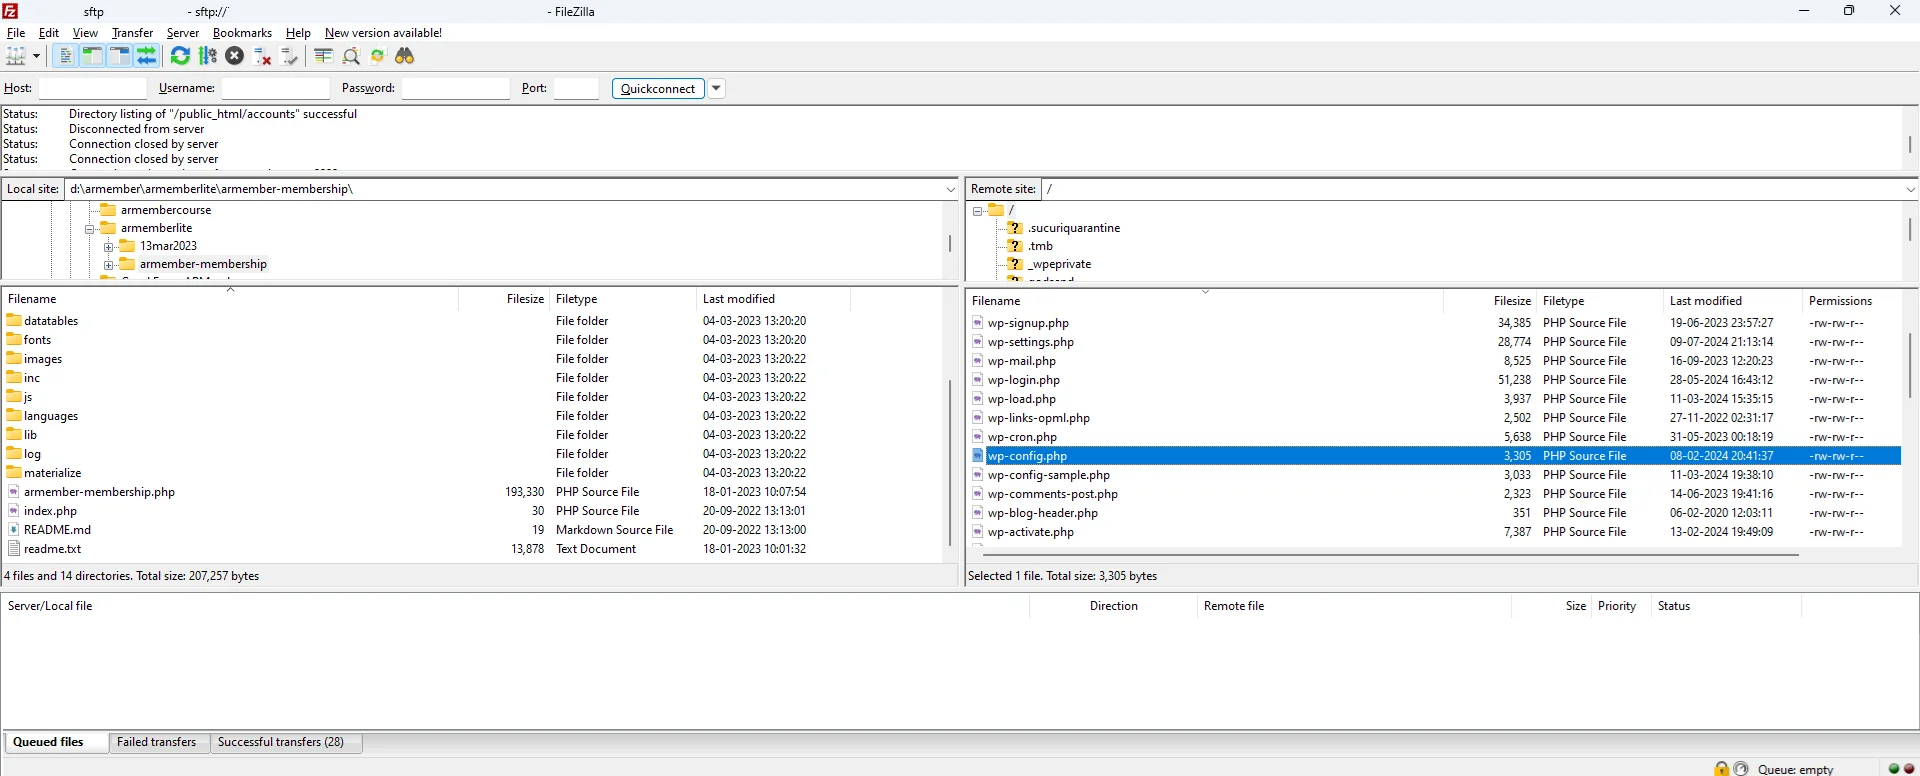
It’s time to look for the wp-config.php File among your varied WordPress files. It is usually found in the root directory of your WordPress installation.
Step-3 Editing the File
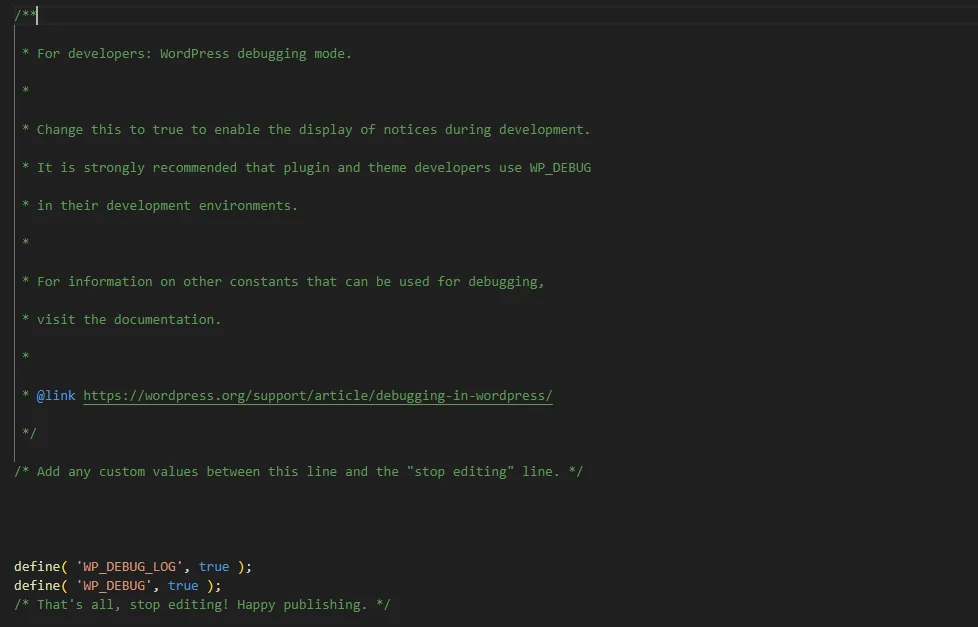
Now, it’s time to edit your wp-config.php File. You can use your preferred text editor or the in-built editor in the cPanel.
Look for the line that says: /* That’s all, stop editing! Happy blogging.*/
This line indicates the end of the editable section of the file.
Just above this line, you can add the following code to enable WP_DEBUG: define(‘WP_DEBUG’, true); If the WP_DEBUG line already exists and is set to false, change it to true.Step-4 Additional/Optional Debugging Functions
While WP_DEBUG is essential, you may also want to enable several other debugging options for more detailed information:
Display Errors: This will show errors directly on the screen. define(‘WP_DEBUG_DISPLAY’, true);
Log Errors:Instead of displaying errors, this will log them to a file. It’s a good practice, especially on live sites. define(‘WP_DEBUG_LOG’, true);
Disable Display on Front-end Errors (Recommended for Live Sites): If you’re on a live site, it’s advisable to log errors rather than display them to users. Use the following code:
define(‘WP_DEBUG_DISPLAY’, false);
WordPress Debug Plugins for Additional Support
WP_DEBUG is a very powerful tool for WordPress. However, if you are looking for other debugging tools and plugins, here are your best options.
- Query Monitor: This provides insights into database queries, hooks, various PHP errors and so much more. This is most beneficial in checking Plugin and Theme conflicts. You only need to install and activate the Plugin for it to start working.
- Error Log Monitor: If you do not want to open the eros log file all the time to keep a check, this Plugin is your answer. It monitors the debug.log file and seamlessly displays all the recent entries directly on your WordPress dashboard.
- Health Check & Troubleshooting: You can check troubleshooting errors in WordPress using debugging tools. It helps to test themes and plugins without any effect on the site visitors.
- WP Debugging: An open source software that helps you to add WP_DEBUG code to your editor and run the debugging function efficiently.
These tools can help in complementing the WP_DEBUG function for a well-rounded debugging management.
Wrapping Up the WordPress Site Debugging Guide
Enabling debugging is pretty easy. I have tried to make it as non-techie as possible for you to follow through. With just a few steps, you can identify the root causes of site issues and fix them in the bud. Make sure you are using a staging site for your debugging and turning the mode off once you’re done with troubleshooting. Learning how to debug your WordPress website can help save a lot of your time by helping you identify errors. It also aids in maintaining a strong site health that is secure!
Read Also:


Leave a Reply
You must be logged in to post a comment.